VeRoViz
06/2022 - 08/2022
Tech Stack:
Description: visualize vehicle routing problem (VRP)
Project Overview
This project is used to visualize Curbhub's delivery orders on multiple vehicles, especially to demonstrate its ability to transfer packages from first leg courier(ex.truck, car) to second leg courier(ex.bike / drone / person).
Completed Tasks ✓
- Change the package size
- How to get a better map layout
- Make the truck not disappear after dropping the package
- ALter the depature time
- Implement a better routing service API
- OSRM - online < MapRequest
Important downloads
- Link of theVeRoViz
- Download CesiumJS fromhere
- You must download this to get the 3D visualization
- This will be a big folder
- Download the VeRoViz Cesium Viewer Plugin fromhere
- You must download this to customize the package model, car model and so on
- This will be a small folder
- You will need to drag the VeRoViz Cesium Viewer Plugin folder to the CesiumJS (picture is shown at below)
- pip install veroviz
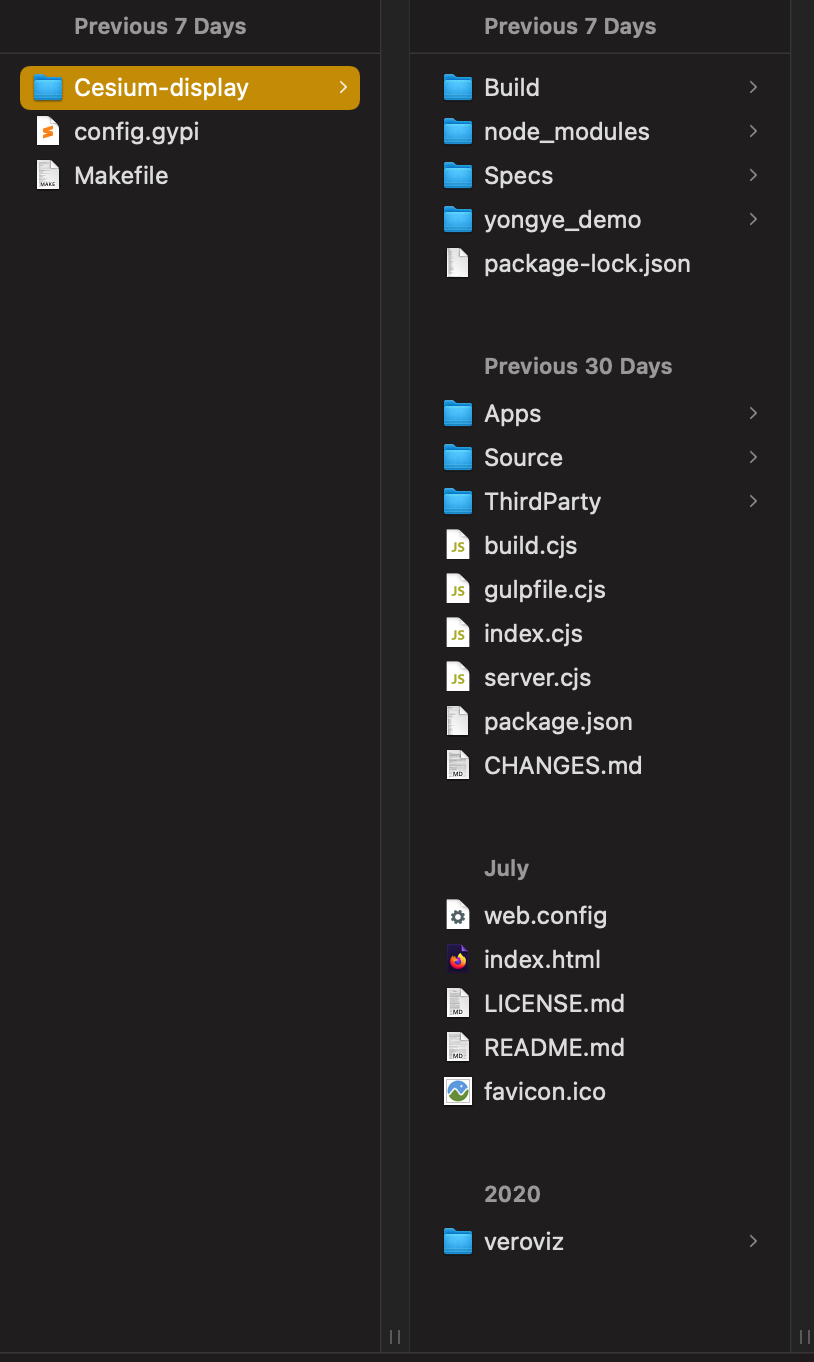
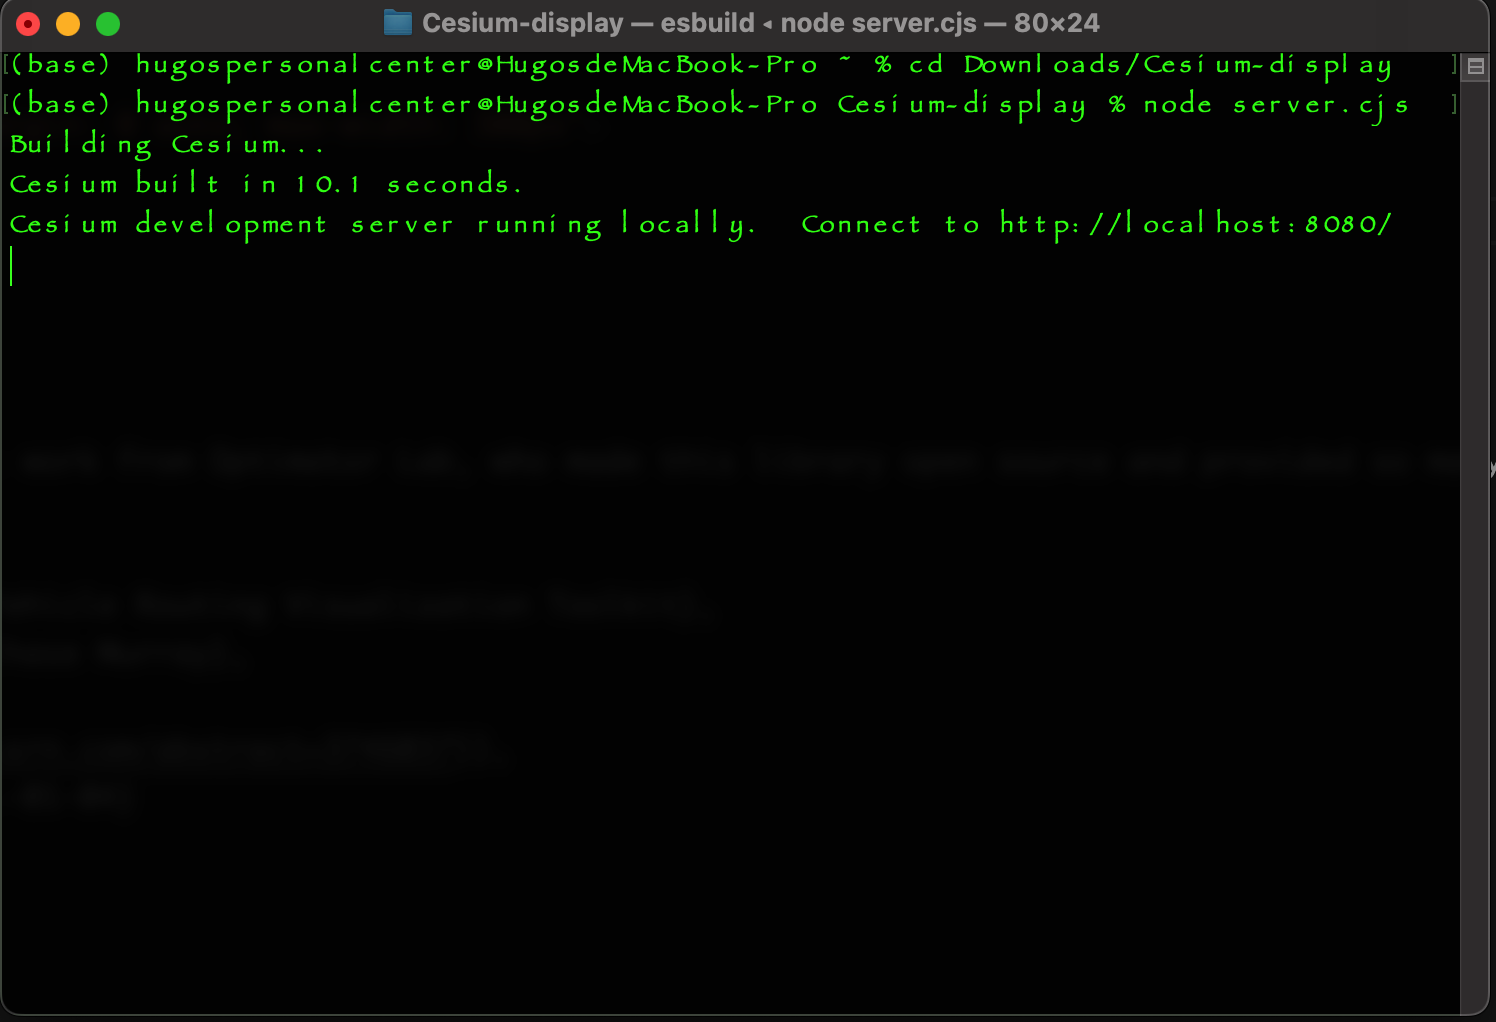
You will notice the veroviz folder is in the CesiumJS folder.One other important file is the "server.cjs", which we will use to activat the server to visualize the 3D model.I have included some info on how to activate the server in the "travel_main_improved.ipynb"
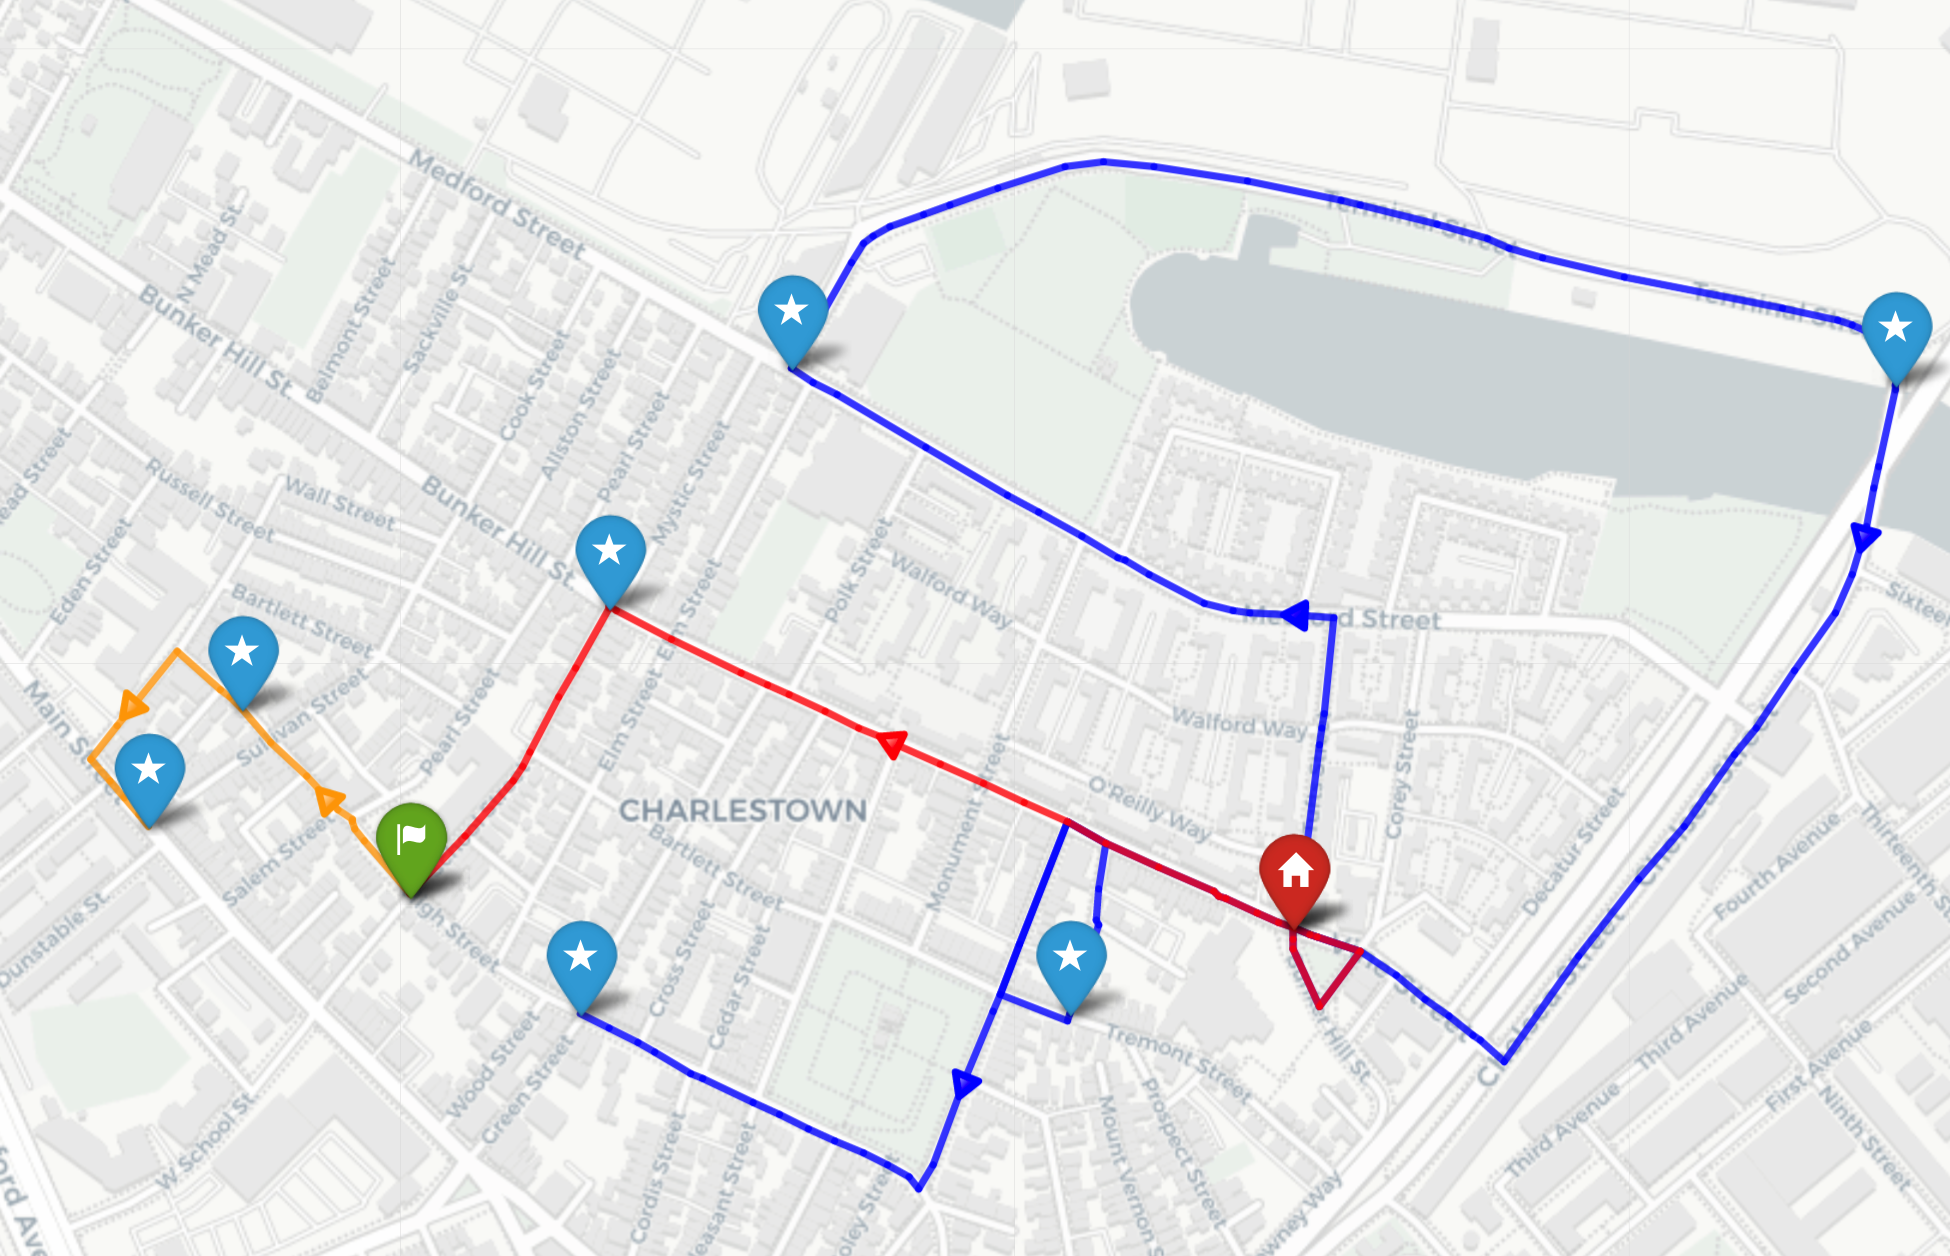
Sample 2D Example
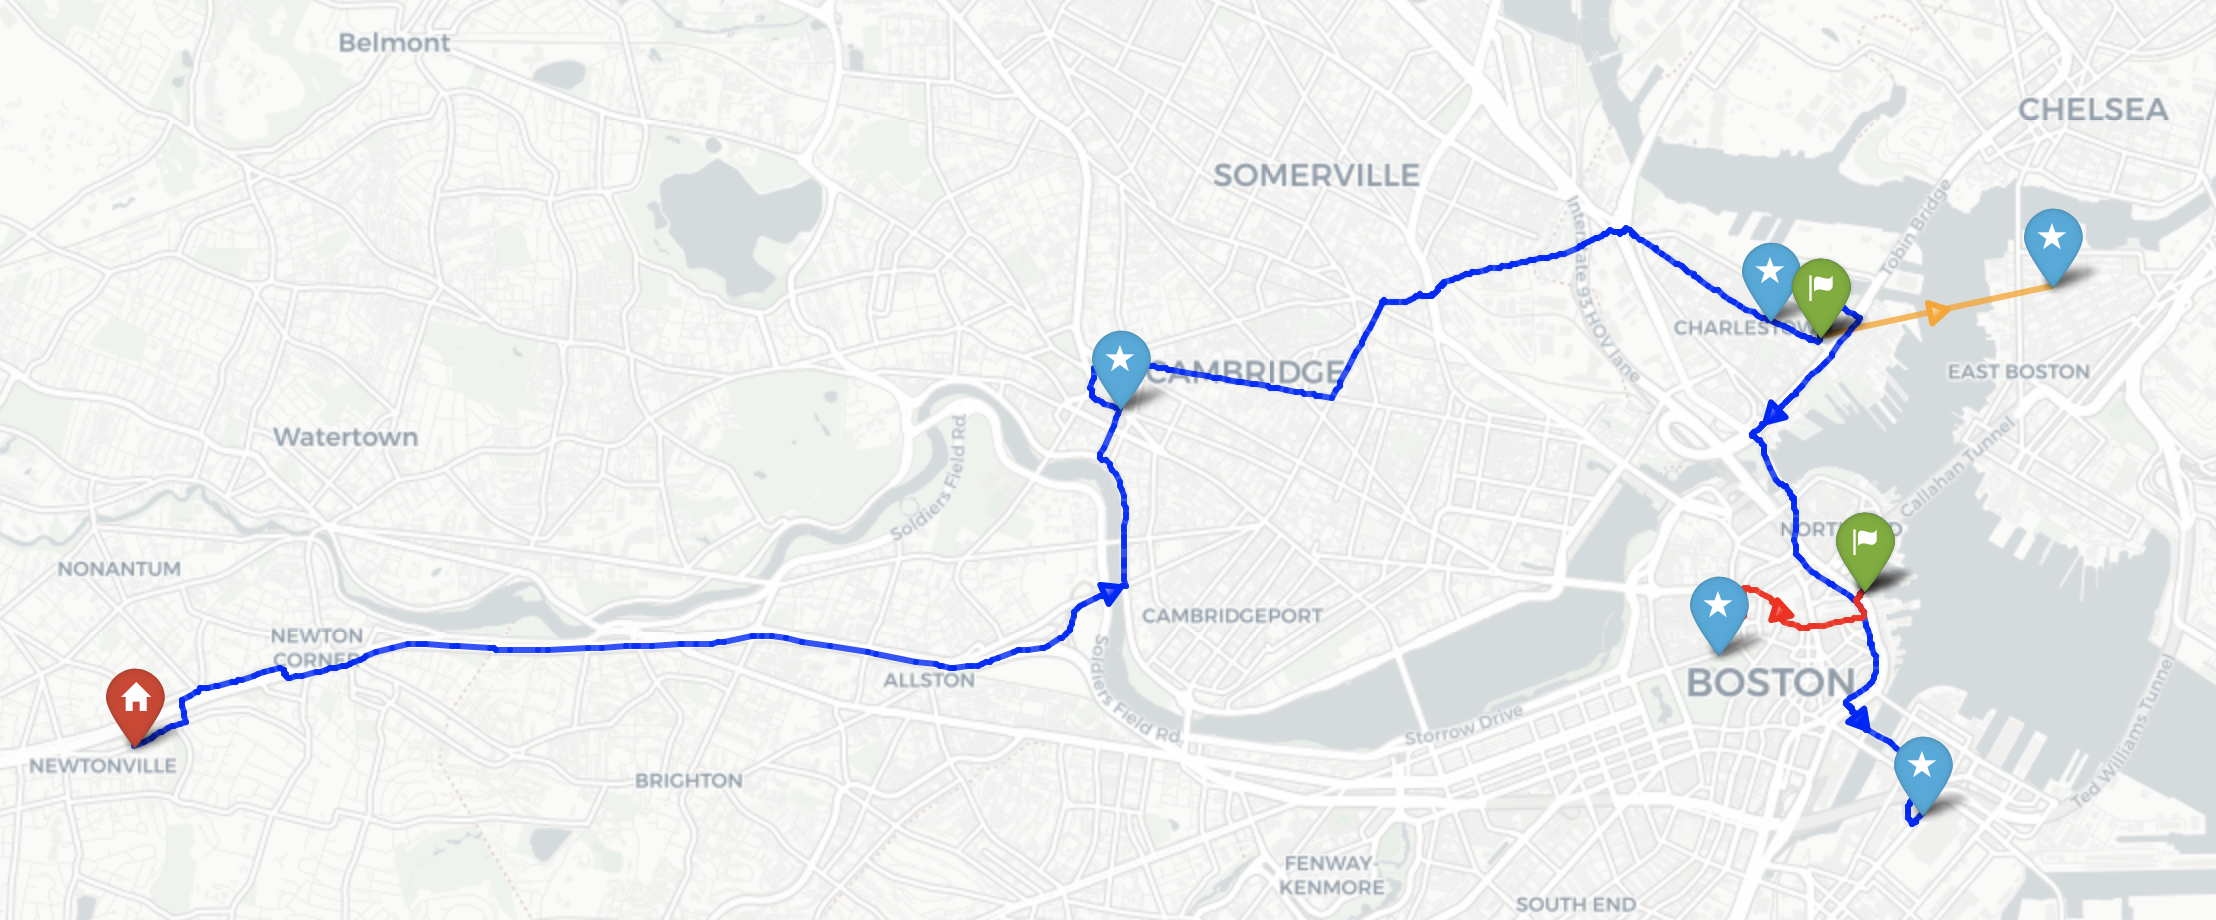
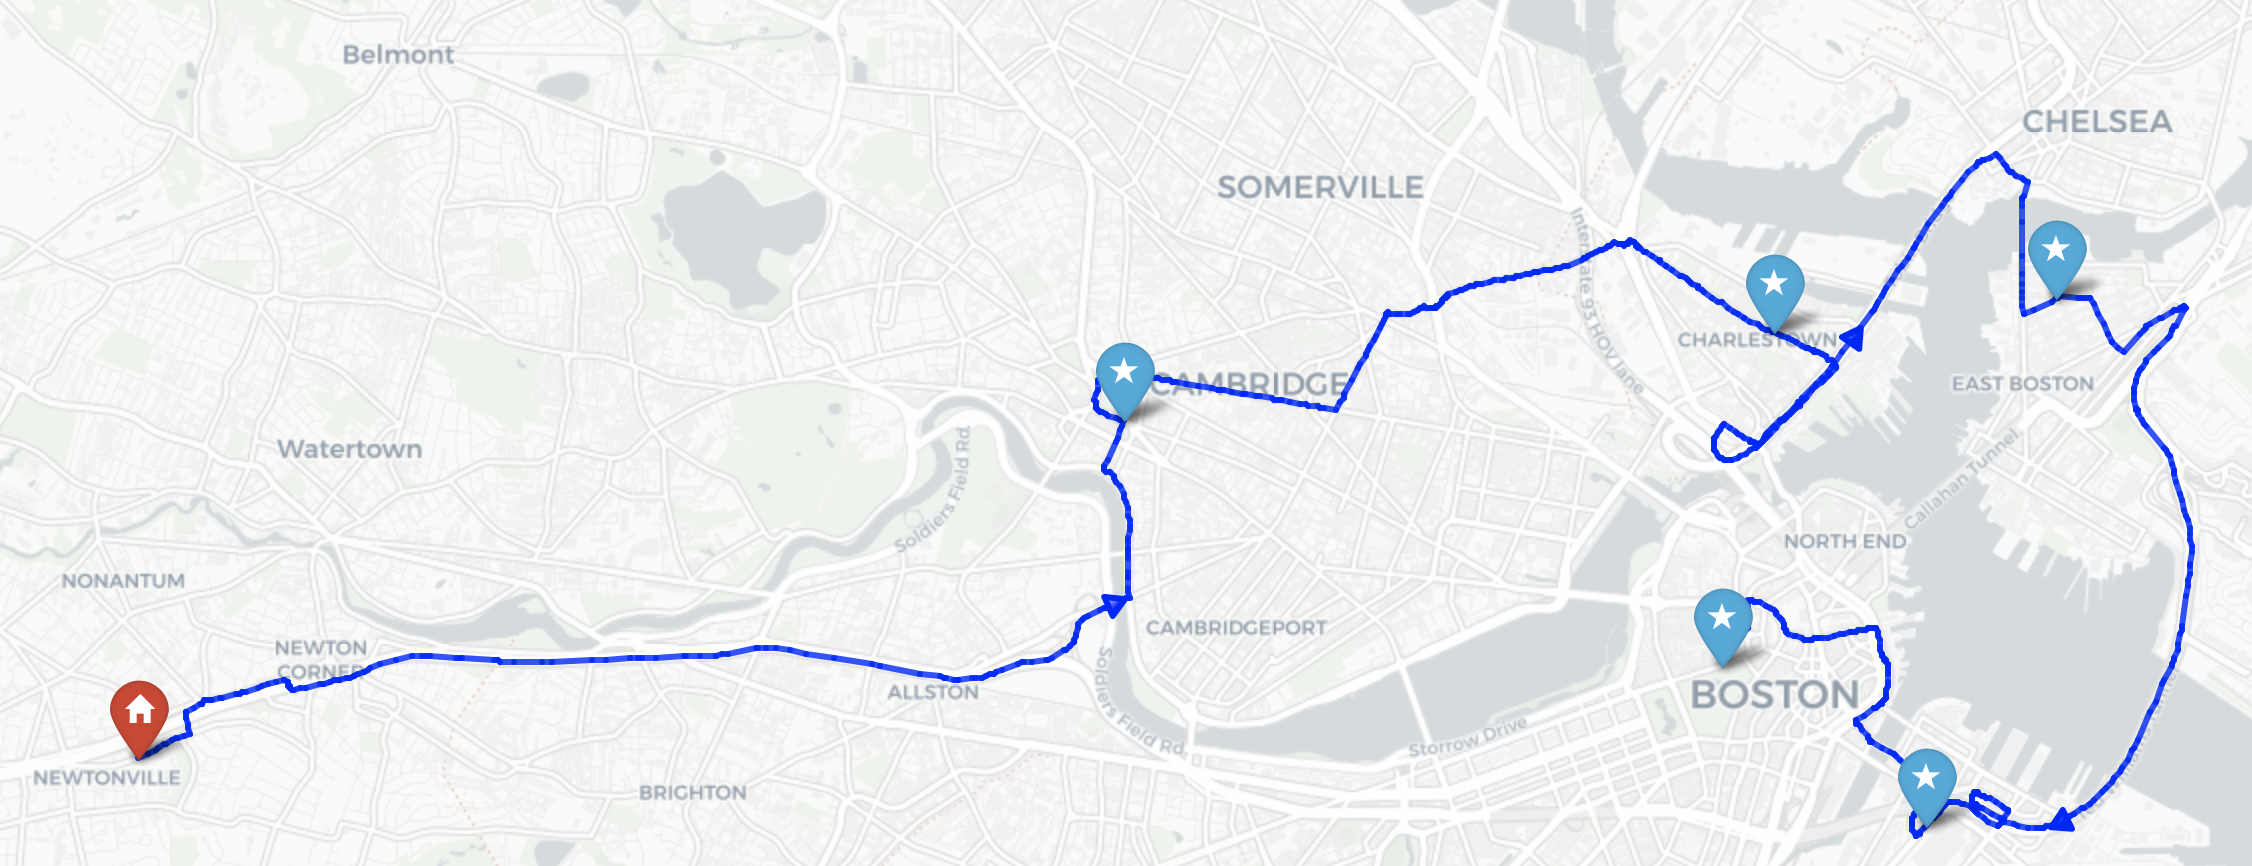
A 2D model with 3 different vehicles: Two trucks and one drone.The city I pick is Charlestown, Massachusetts. There are many icons on the graph.The icon with blue star is "delivery order", and the icon with red home is "warehouse", and lastly the one with "green flag" is "transship point".
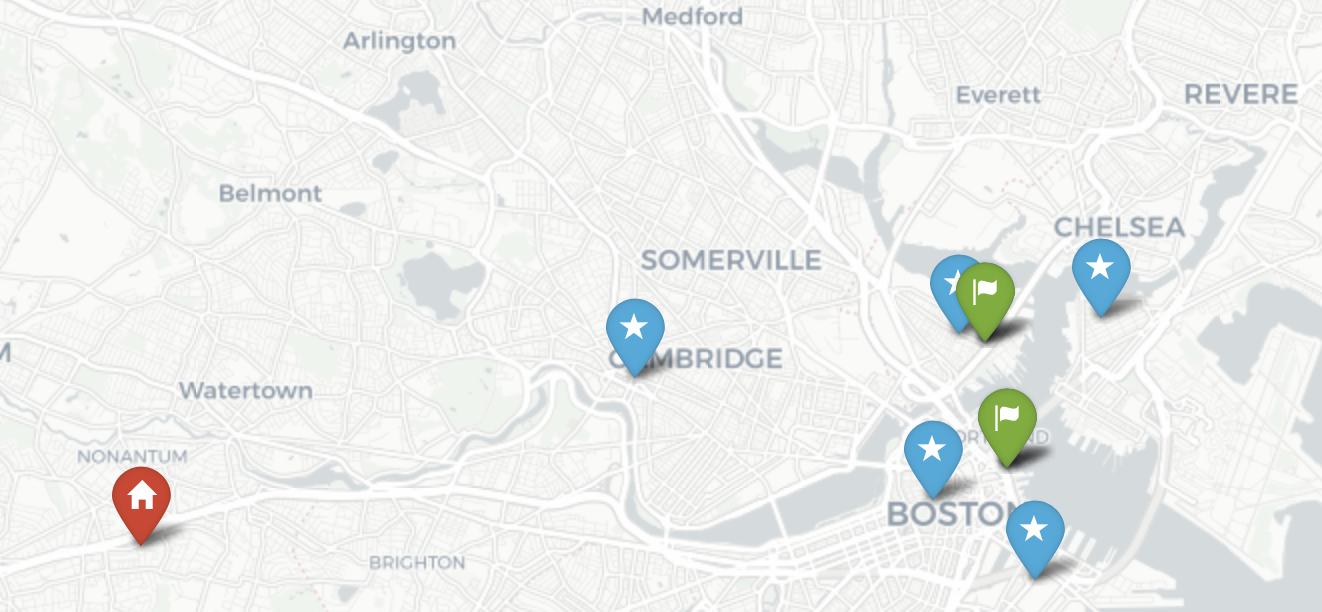
** Below are for Home Delivery **
3D Demonstration
I have included the sample video. (with watermarks)
Videos for Home Delivery Conference(without watermarks)
This is the one without transship points.
This is the one with transship points.
Credit
We have to thank for the excellent work from Optimator Lab, who made this library open source and provided so many awesome functionality.
@Misc{veroviz2020,
    title        = {{VeRoViz}: A Vehicle Routing Visualization Toolkit},
    author       = {Lan Peng and Chase Murray},
    year         = {2020},
    howpublished = {\url{https://ssrn.com/abstract=3746037}},
    note         = {Accessed: 2021-01-04}
}